The Chrome console is one of the must-have tools for many developers building games with Cocos Creator. But have you really grasped the power of using it? Do you still rely solely on console.log() to troubleshoot problems? In fact, the function of the console is far more powerful than this. Using the console well can help us find and locate problems more accurately and efficiently, but it can't find all the bugs.
Today, we will share frequently used Chrome console debugging functions and how to use them. Hopefully, to help you better debug your Cocos Creator projects in the Chrome console.
PART 1 - Chrome Debugging Basics
1.1 Use code snippets to run JavaScript on any web page
Code snippets can be used instead of a bookmarklet. Code snippets are scripts authored in the source tool. The snippet has access to the JavaScript context of the webpage, and you can run the snippet on any webpage.
Snippets are an excellent alternative to bookmarklets because snippets only run in DevTools and are not limited to the allowed length of URLs.
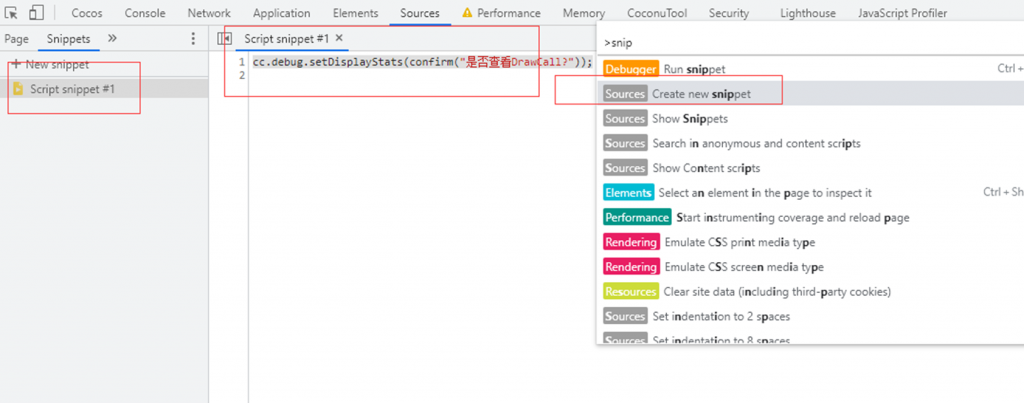
The example shown in this image shows how convenient it is to view items, save them, and format the code in a new line.
1.2 Getting Started with Debugging JavaScript
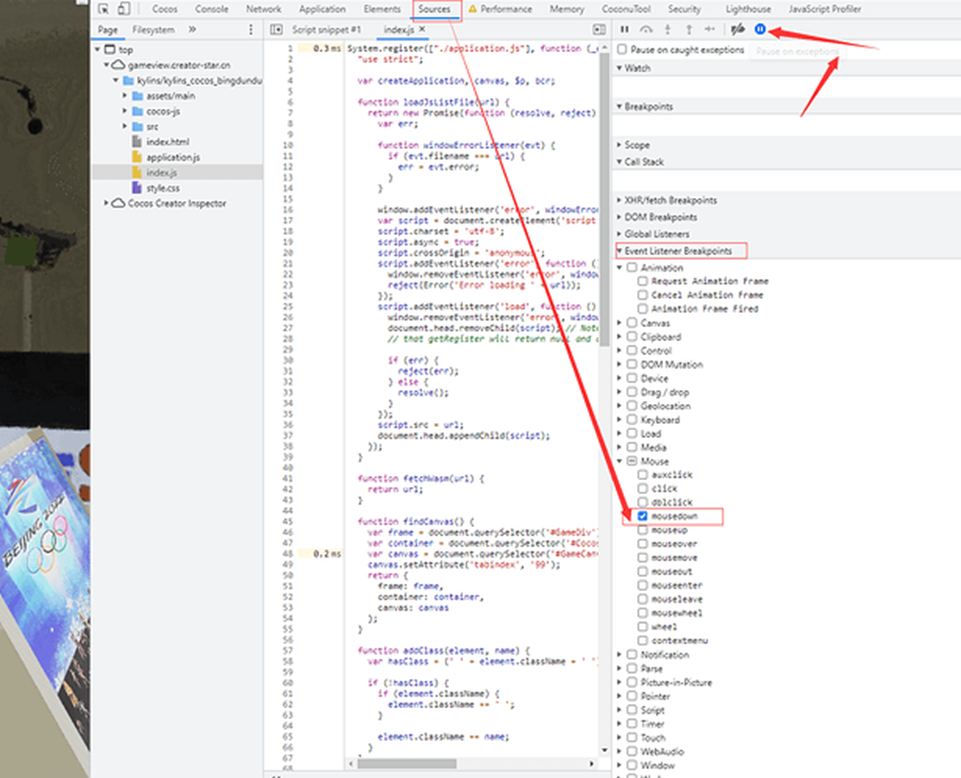
The event listener breakpoint can automatically debug the breakpoint. It is recommended to turn on "Pause on exceptions" during the breakpoints.
In the Sources pane, click Event Listener Breakpoints to expand the section. The authoring tools display a list of expandable event categories, such as Animation and Clipboard.
Next to the Mouse events category, click to expand to display a list of mouse events, such as click and mousedown. There is a check box next to each event. Check the box. The dev tools are now set to pause when any checked event happens automatically.
The example is shown below. It automatically listens to the user click event and then breaks at that point. "Pause on exceptions" can automatically create error breakpoints that track code errors and then automatically break as well.
1.3 Monitoring changes in JavaScript using live expressions
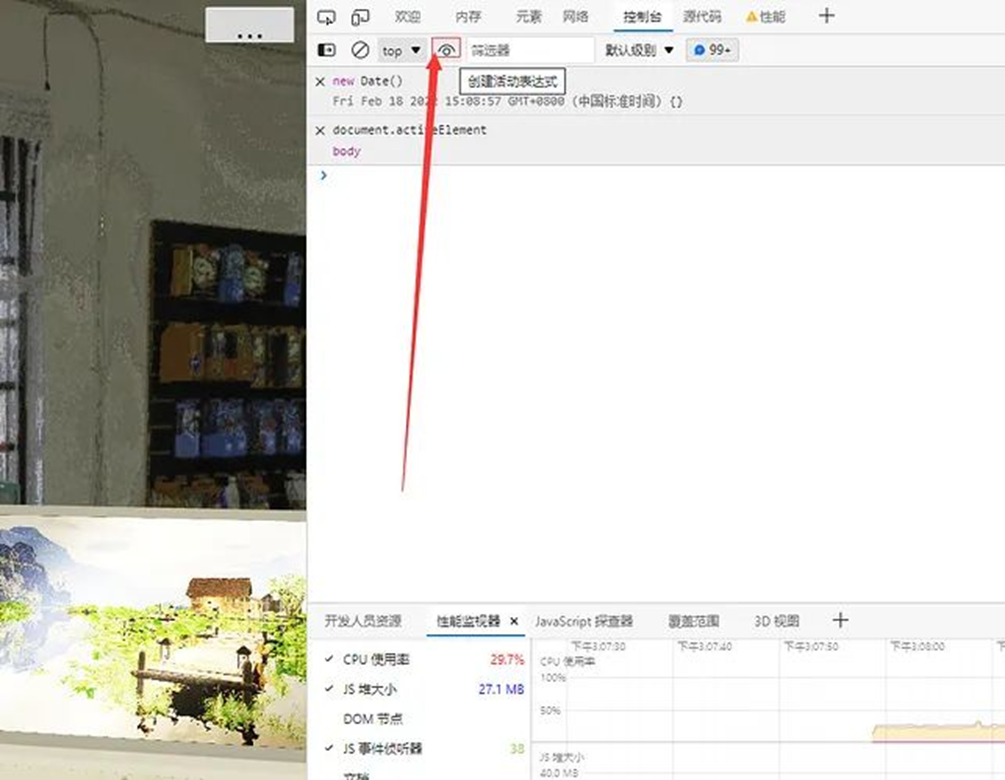
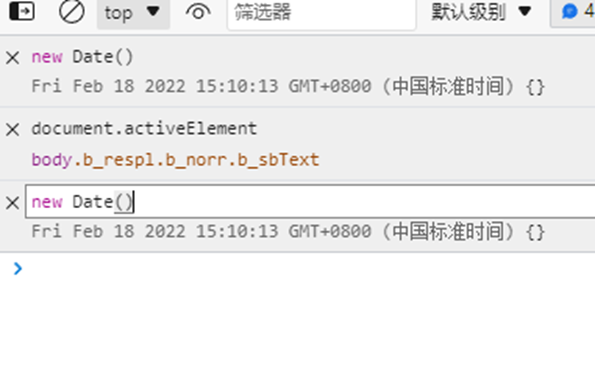
If you want to add a new real-time expression, click the little eye, and enter the expression.
1.4 Analyzing runtime performance
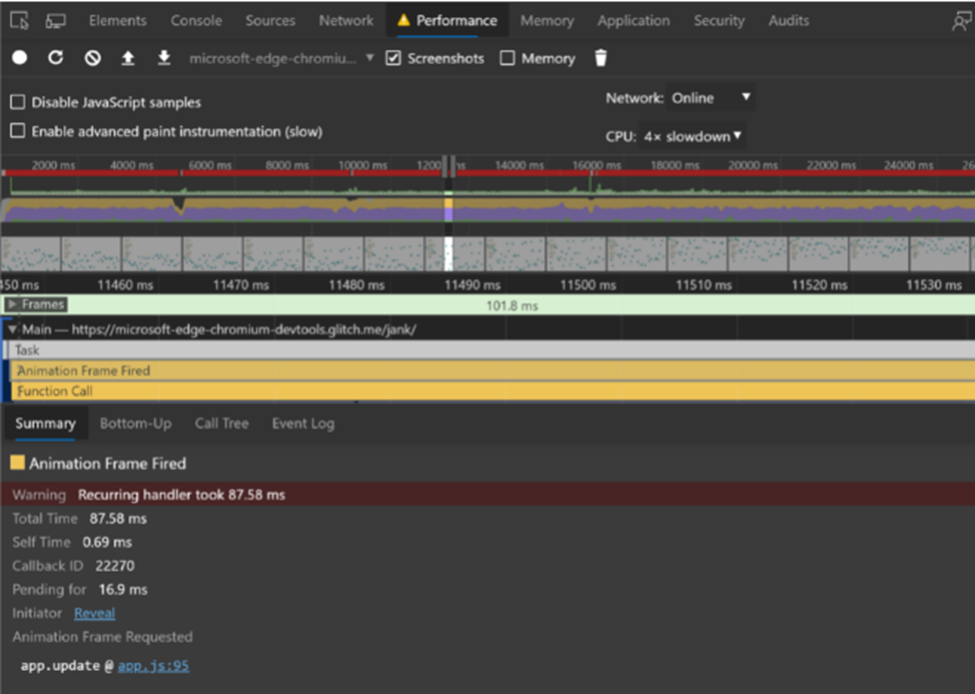
Use the DevTools performance tool to find performance bottlenecks on the page through the Performance panel.
You can simulate the mobile CPU, which can simulate the iOS environment, which is very convenient for testing, and we recommend it. Mobile devices have less CPU power than desktops and laptops.
This can be done by opening the performance tab clicking on what things you want to record—then clicking the record button. You can also use the setting tab to do more advanced CPU and network throttling.

When testing, if you want to make sure your app works well on low-end mobile devices, set the CPU limit to a 6x slowdown.
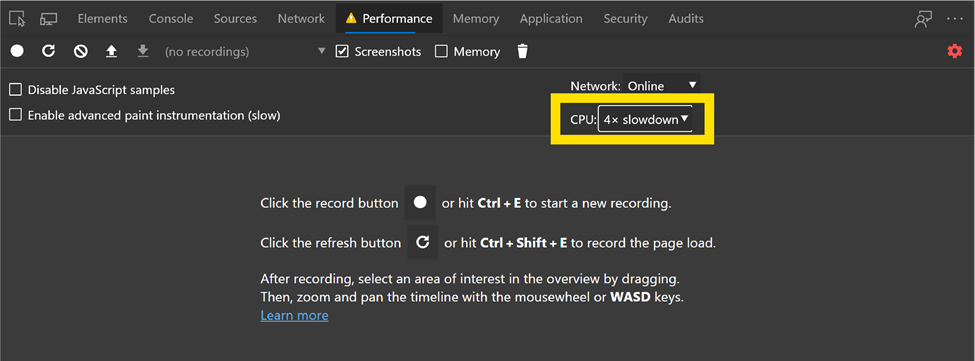
Whenever you analyze a game, you can use CPU throttling to simulate how the behavior acts on a mobile device. You can do this by following simple steps:
- Record runtime performance. You can monitor the time-consuming part of the code Long Task (recommended).
- As you record, a blue icon will come up. This is the buffer usage. If you record for too long, you will lose data as the buffer fills.
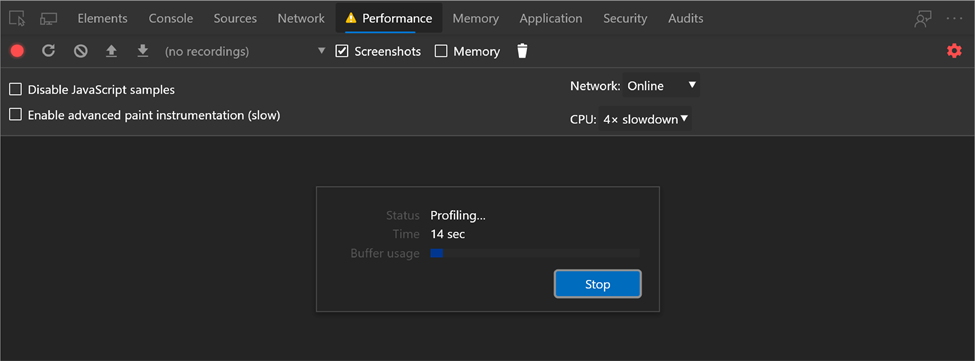
- Record a few frames per second. The primary metric for measuring the performance of any animation is frames per second (FPS). Users will enjoy it when the animation runs at 60 FPS.
- Find bottlenecks after console recording Performance. After measuring and verifying that the animation is not working well, the next step is to answer the question "why?"
- Check the FPS Chart as shown below. Whenever the red bar shows up below the FPS, it means the FPS dropped too low—hurting the user experience. Green indicates no issues.
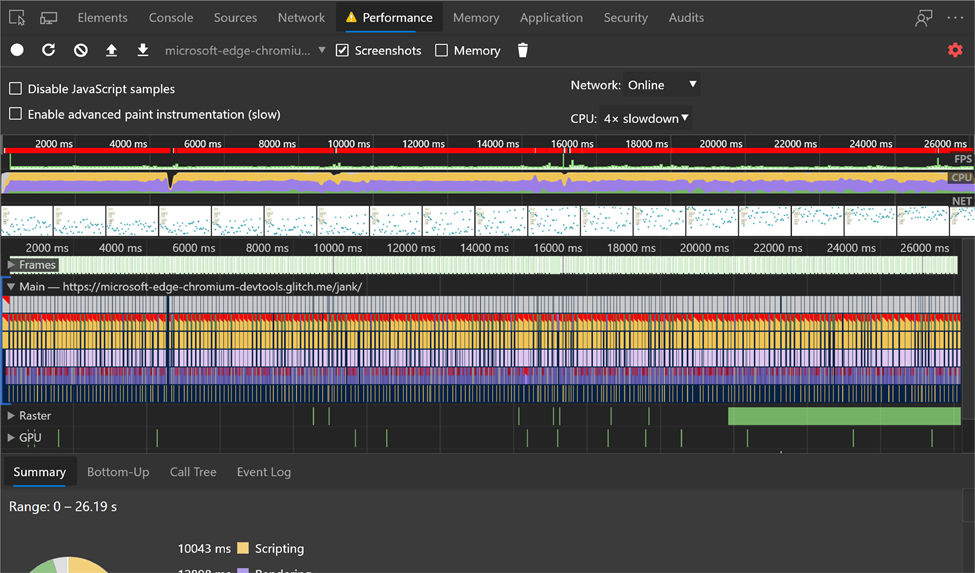
- Below the FPS Chart is the CPU Graph. The colors represent the different items in the summary panel. If the CPU goes past the top of the chart, it has reached its full usage. Each color means a different item: HTML(blue), CSS (purple), JavaScript (yellow), Images (Green)

- Hovering under the FPS and CPU graphs, you can see that the DevTool will display a screenshot of the page at certain times. It can be used to see what was happening during spikes in CPU and FPS.
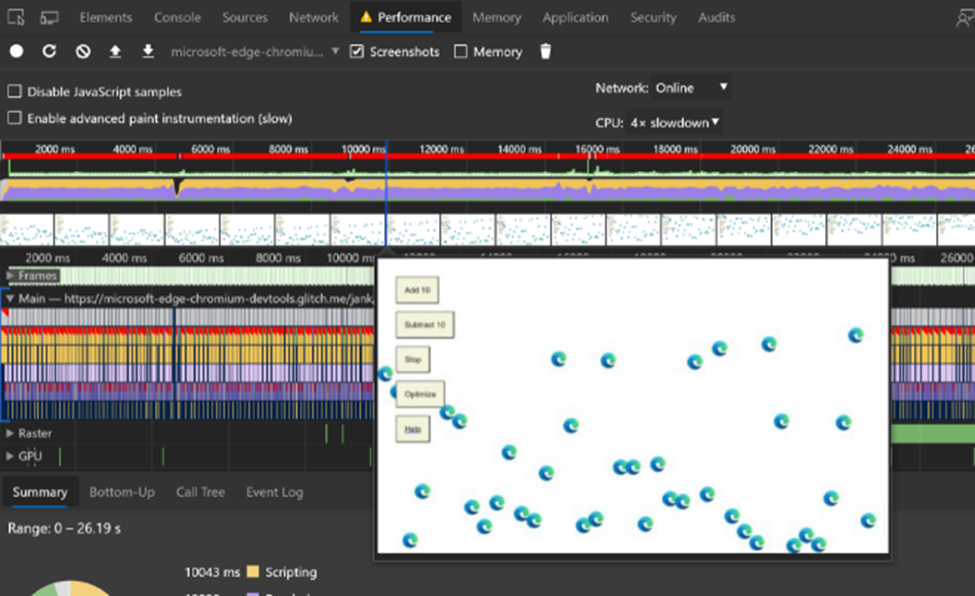
- Under the images, there is another area called Frames. You can see how many frames were rendered at a specific time by hovering over it with your mouse.

- If you want to have a real-time look at the FPS happening, you can view it by opening the command menu by pressing Ctr + Shift + p (cmd + shift + p on mac). Then enter fps to view the frame rate. You can also type rendering to show off the GPU raster and GPU rendering.
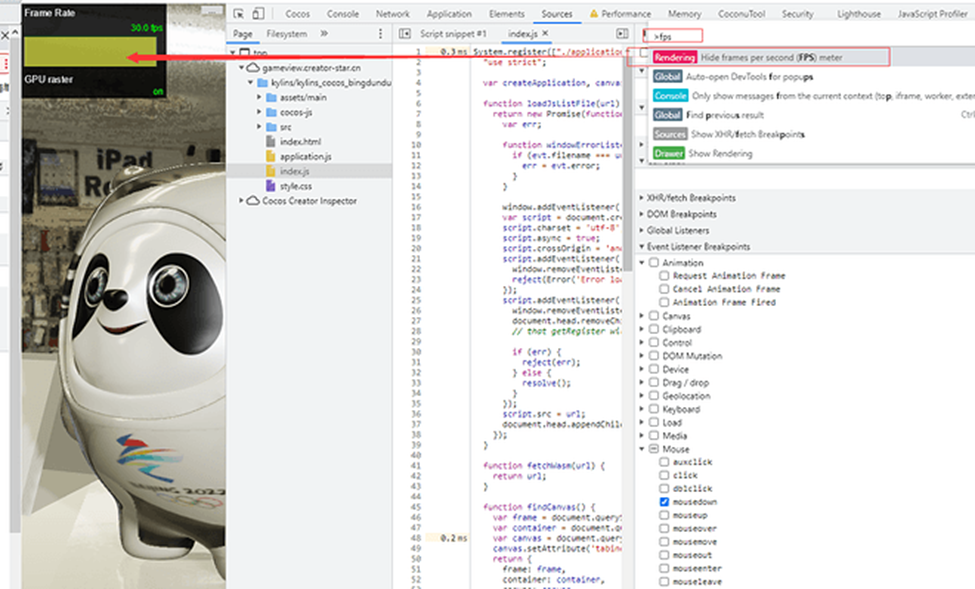
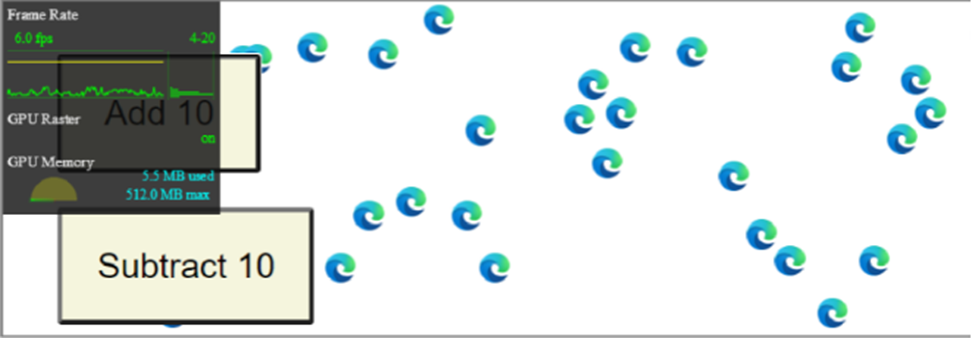
Analyze runtime performance after console recording performance When no events are selected, the Summary panel displays a breakdown of the activity. The page is rendering most of the time. Since performance is the art of reducing workload, your goal is to reduce the time spent doing drawing work.
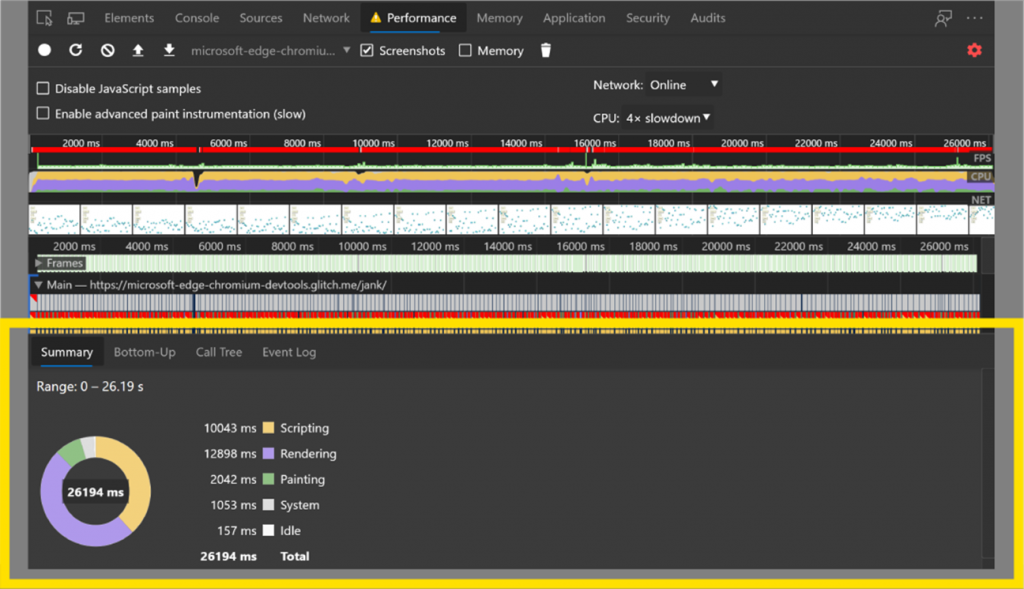
Google Chrome allows you to zoom in and highlight different tasks being run by zooming into the main section. The same can be done for the GPU, NET, and other items.
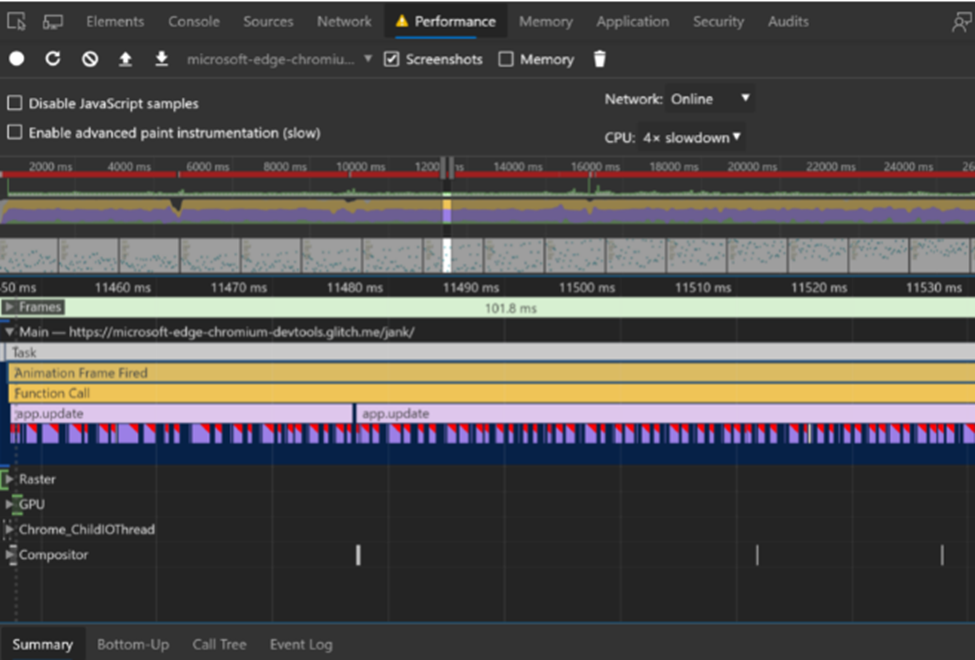
Clicking on one item can tell you the time it took to complete. Allowing you to go back to the code and fix speed issues.
1.5 Run JavaScript in the console for simple execution of commonly used testing requests.
You can enter simple code in the console. Any JavaScript expression, statement, or snippet can be entered into the console, and it will run interactively as soon as you type it. This works because the console tool in DevTools is a REPL environment. (REPL stands for Read, Evaluate, Print, and Loop.)
Auto-completion of complex expressions written in the console (code written in Cocos will also have automatic code prompts). The console helps you write complex JavaScript with autocompletion. This feature is a great way to learn about JavaScript methods you didn't know before.
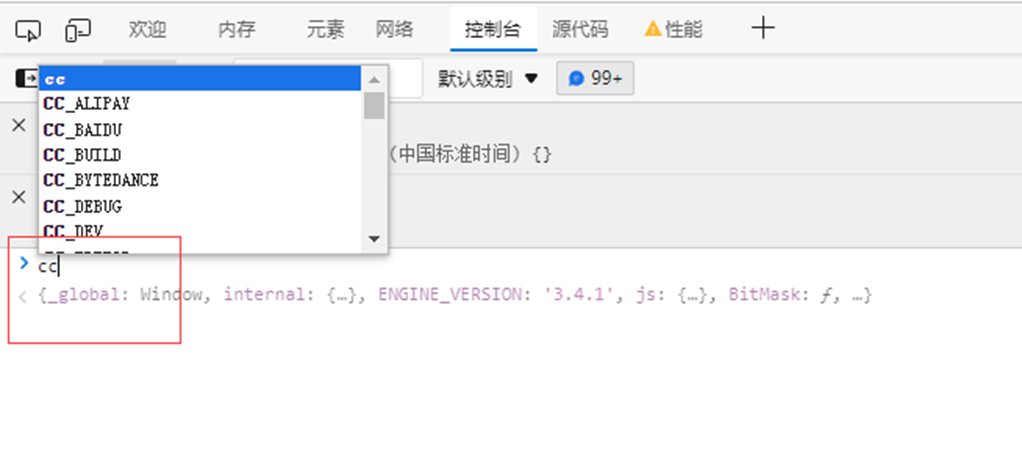
Console input is great with Chrome as it has many features:
- Console history. Previously entered code can also be found and used again within the console for multi-testing.
- Console multi-line editing. By default, the console provides only one line to write JavaScript expressions. If you start a multi-line statement in the console by using shift+enter, code blocks are automatically recognized as indented.
- The console uses top-level await() for network requests. Besides your own scripts, the console also supports top-level await to run arbitrary asynchronous JavaScript within it.
1.6 Performance function reference
How do you analyze page performance with performance tools? We recommend more than 30 DevTools performance functions that can be commonly used for testing:
For Recording performance:
- Record Runtime Performance
- Record Loading Performance
- Capture Screenshots While Recording
- Force Garbage Collection While Recording
- Show Recording Settings
- Disable JavaScript Examples
- Limit Network While Recording
- Limit CPU While Recording
- Enable Advanced Paint Detection Tool
- Save the recording
- Load recordings
- Clear previous record
For Analysis performance recording:
- Select part of a recording
- Search for the activity
- View main thread activity
- View activity in tables (root activity, call tree tab, bottom-up panel, event log panel)
- View GPU activity, view raster activity, view interactions, analytics Frames per second (FPS) (FPS graph, frames section)
- View network requests and view memory metrics
- View duration of partial recordings
PART 2 Measuring performance with RAIL models
RAIL is a user-centric performance model that provides a structure for considering performance. This model breaks down the user experience into key actions (e.g., click, scroll, load) and helps you define performance goals for each action.
RAIL represents four different aspects of the web application life cycle: responsive, animated, idle, and loaded. Users have different performance expectations for each context, so performance goals are defined based on context and UX research on how users perceive latency.
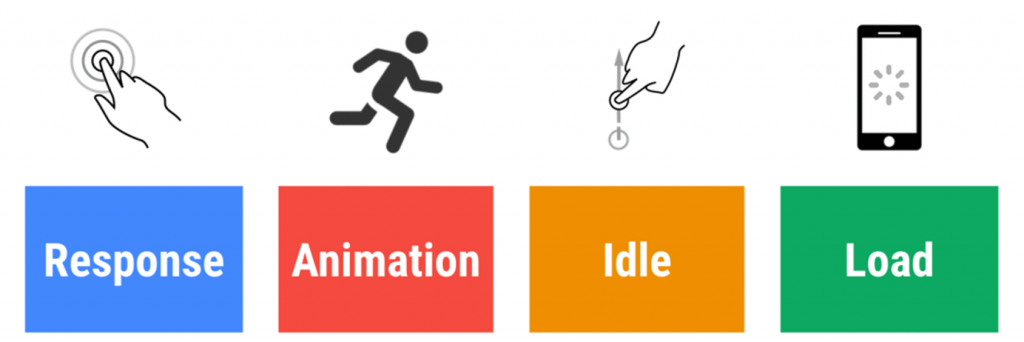
RAIL puts the user at the crux of the performance effort. The following table describes key metrics of how users perceive performance latency:
| 0 – 16 ms | Users are exceptionally good at tracking motion, and they dislike it when animations aren't smooth. They perceive animations as smooth so long as 60 new frames are rendered every second. That's 6 ms per frame, including the time it takes for the browser to paint the new frame to the screen, leaving an app about 10 ms to produce a frame. |
| 0 – 100 ms | Respond to user actions within this time window, and users feel like the result is immediate. Any longer and the connection between action and reaction is broken. |
| 100 – 1000 ms | Within this window, things feel part of a natural and continuous progression of tasks. For most users on the web, loading pages or changing views represents a task. |
| Over 1000 ms | Beyond 1000 milliseconds (1 second), users lose focus on the task they are performing. |
| Over 10,000 ms | Beyond 10000 milliseconds (10 seconds), users are frustrated and are likely to abandon tasks. They may or may not come back later. |
Via Web.dev
User perception of performance latency varies, depending on network conditions and hardware. For example, with a fast Wi-Fi connection, loading a site on a powerful desktop typically takes less than a second, which users are accustomed to. Sites can take longer to load on mobile devices over slower 3G connections, so mobile users are generally more patient if they know they are on a slower connection. On mobile devices, loading within 5 seconds is a realistic goal.
2.1 Handle events within 50ms
Goal: Complete transitions initiated by user input within 100 milliseconds, making the interaction feel immediate to the user.
Guidelines :
- To ensure a visible response within 100ms, the user input event needs to be handled within 50ms. This works for most inputs, such as clicking a button, toggling an option, or starting an animation. However, this doesn't work with touch dragging or scrolling.
- As paradoxical as it may sound, responding to user input instantly is not always the right thing to do. You can use this 100ms window to perform other resource-intensive work, but be careful not to get in the way of the user. You should work within the background if possible.
- Feel free to provide feedback on operations that take more than 50ms to complete.
Why is our budget only 50ms? This is because there is often work that needs to be performed in addition to input processing, and that work takes up part of the time available for an acceptable input response. If an application executes work in the recommended 50ms chunks during idle time, this means that if an input occurs in one of these work chunks, it may be queued for up to 50ms. With that in mind, it's safe to assume that only the remaining 50ms are available for actual input processing. This effect is illustrated in the following diagram, which shows how input received during idle tasks is queued, reducing the available processing time:
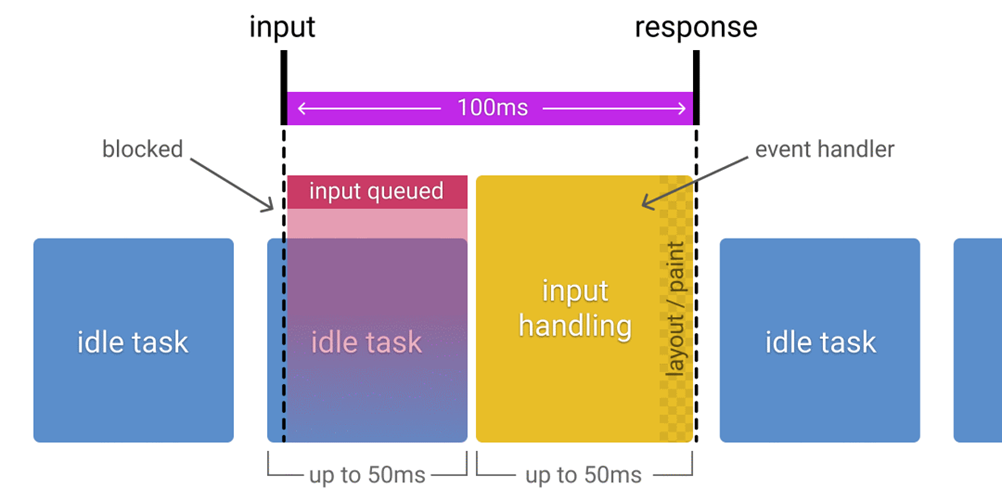
How idle tasks affect input response budgets
2.2 Animation: generate a frame in 10ms
Target:
- Generate each frame of the animation in 10ms or less. Technically, the maximum budget per frame is 16ms (1000ms / 60 frames per second ≈ 16ms). However, the browser takes about 6ms to render a frame, so the guideline is 10ms per frame.
- The goal is smooth visuals. Users will notice a change in frame rate.
Guidelines :
- In scenarios such as animation, where computational speed is critical, it is crucial that you do not perform any other operations, even if feasible, and keep the operations that cannot be performed to an absolute minimum. Whenever possible, you use this 100ms response time to precompute the most resource-intensive work, maximizing your chances of hitting 60fps.
- See this article on Rendering Performance for various animation optimization strategies.
2.3 Idle: Maximize idle time
Goal: Maximize idle time to improve the game's chance to respond to user input within 50 milliseconds.
Guidelines :
- Use idle time to complete deferred work. For example, load as little data as possible for the initial page load and then use idle time to load the rest.
- Execute work in 50ms or less of idle time. If it takes longer, you may interfere with your app's ability to respond to user input within 50 milliseconds.
- If the user interacts with the game during idle time work, the idle time work should be interrupted. User interaction always has the highest priority.
2.4 Loading: Deliver content and make it interactable in 5 seconds
When a new screen loads slowly, users get distracted and think the task has been interrupted. Fast-loading screens have longer average session times, lower bounce rates, and higher ad visibility.
PART 3 - console code
Finally, add some advanced "technology"! We can use code to operate the console better and faster. The following are a few functions that we commonly use.
- Use
console.log,console.error,console.warnto categorize the information output to the console - Combined with
console.group&console.groupEnd, this idea of classification management can be brought to the extreme - Regarding
console.log, Chrome provides such an API: the first parameter can contain some formatted instructions such as%c - Output data directly in tabular form:
console.table - Condition judgment output log:
console.assert - count log:
console.count - Data tree output:
console.dir - Function execution time calculation output:
console.time&console.timeEnd - View information about CPU usage:
console.profile - Stack trace related debugging:
console.trace - Contents of the console:
$_ - Copy the data structure of the console:
copy - Object operation:
keys&values monitor&unmonitor:monitor(function), which receives a function name as a parameter. For example, let's usefunction a. Every timeais executed, it will output a message to the console, which contains the namefunction aand parameters passed in during execution. Andunmonitor(function)is used to stop this monitoring.debug&undebug:debugalso accepts a function name as a parameter. When the function is executed, it is automatically broken for debugging, which is similar to setting a breakpoint at the entry of the function, which can be done through the debugger or by finding the corresponding source code in the Chrome developer tools and breaking it manually. Instead, useundebugto release the breakpoint.
3.1 Identify factors that affect page load performance:
- Network Speed and Latency
- Hardware (e.g., slower CPU)
- cache eviction
- Differences in L2/L3 cache
- Parse JavaScript
Tools to measure RAIL
There are tools to help you automate RAIL measurements. Which one to use depends on what type of information you need and what type of workflow you prefer.
Chrome DevTools
Chrome DevTools provides an in-depth analysis of everything that happens when a page is loaded or run. See Getting Started with Analyzing Runtime Performance to get familiar with the Performance panel UI.
3.2 The following DevTools features are closely related:
- Limit CPU performance to emulate less powerful devices.
- Limit the network speed to simulate a slower connection.
- View Main Thread Activity to see every event that occurred on the main thread at the time of recording.
- View the main thread activity in the table to sort the activities based on how much time they took up.
- Analyze frames per second (FPS) to measure whether your animations run really smoothly.
- Use Performance Monitor to monitor CPU usage, JS heap size, DOM node count, layouts per second, and more in real-time.
- Use the Network section to visualize network requests that occur while recording.
- Capture screenshots while recording for accurate playback of how the page will look when loaded, triggered animations, etc.
- View interactions to quickly identify what happens on the page after the user interacts with it.
- Find scrolling performance issues in real-time by highlighting pages when potential issue listeners fire.
- View paint events in real-time to identify resource-intensive paint events that can hurt animation performance.
Lighthouse
Lighthouse is available as a Chrome extension and Node.js module in Chrome DevTools under web.dev/measure and in WebPageTest. As long as you provide a URL, it runs a series of audits on the page, simulating a midrange device using a slower 3G connection. It then provides a report on loading performance and suggestions for improvement.
3.3 The following audits can also be used:
Response
- Maximum first input delay time 1. Estimate how long it takes your app to respond to user input based on the main thread idle time.
- Does not use passive listeners to improve scrolling performance.
- Total blocking time. Measures the total time a page prevents a response to user input (such as mouse clicks, screen clicks, or keystrokes).
- Interaction time. Measure when users can interact with all page elements steadily.
Load
- Do not register service worker processes that control page and start_url. Service worker processes can cache common resources on user devices, reducing its time to fetch resources over the network.
- Pages on the mobile web aren't loading fast enough.
- Eliminate render-blocking resources.
- Delay processing of offscreen images. Defer offscreen images to load when needed.
- Resize the image appropriately. Do not provide images that are significantly larger than the dimensions rendered in the mobile viewport.
- Avoid chaining critical requests.
- Don't use HTTP/2 for all of its resources.
- Efficiently encode images.
- Enable text compression.
- Avoid overloading the network.
- Avoid overly large DOM sizes. Reduce the number of network bytes by passing only the DOM nodes needed to render the page.
WebPageTest web page performance testing tool
WebPageTest is a web page performance testing tool that uses real browsers to visit web pages and collect timing metrics. Enter a URL at webpagetest.org/easy, and you can get a report on the loading performance of that page on an actual Moto G4 device using a slower 3G connection. You can also configure it to include Lighthouse auditing.
Additional Reference link:
Microsoft Edge Development
https://docs.microsoft.com/en-us/microsoft-edge/devtools-guide-chromium/
Measuring performance with RAIL models
https://web.dev/rail/?utm_source=devtools#goals-and-guidelines


