Improving your testing experience is a huge request from game developers moving from one game engine to Cocos Creator. We’ve heard the news and our star developer, Iwae, is here to help you with the ultimate testing project.
EasyMenu comes with a ton of testing code to help you plug in your own items or even use in your own projects to help you in the testing phase of your games. But let’s have Iwae introduce this to you!
Introduction to easyMenu
Using built-in UI components to create a debugging panel is usually a slow and cumbersome process. To solve this problem, the two meow open source debugging panel, easyMenu, balanced between practicality and aesthetics.
This debug panel supports adding menu components in bulk, just as easy as using tween. You can add multiple items quickly, and it's very easy to maintain!
The debug panel has some useful built-in debugging modules, so let's take a look at how you can use these features and functions to pinpoint some performance issues with your game quickly.
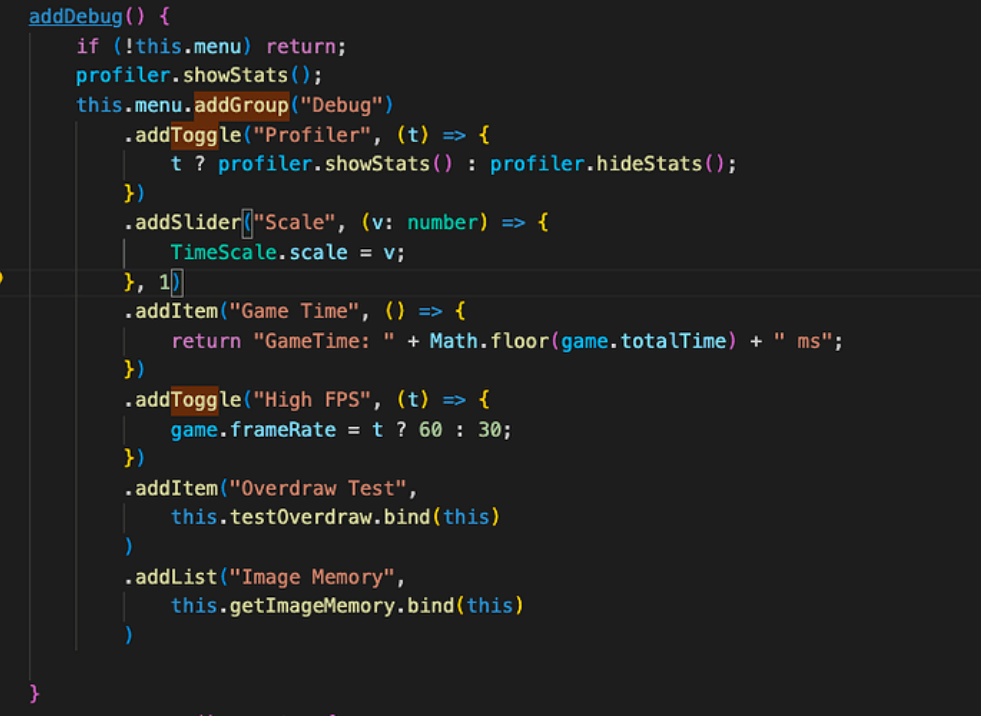
FPS Shortcut Settings
The debug panel allows us to manually set the FPS (frames per second) in order to test
the performance. 30 FPS will have less overhead and heating, but the smoothness will be reduced.
const Debug = this.menu.addGroup("Debug");Debug.addToggle("High FPS", (t) => { game.frameRate = t ? 60 : 30;})
FPS toggles can be added quickly with just two lines of code, and you can click the toggle button to toggle between 30 FPS and 60 FPS quickly.
FPS Monitoring
As we mentioned, FPS toggle, let's talk about FPS monitoring. By default, the engine only provides the current FPS value, and it can't monitor the change of FPS.
eMenu provides an eGraph monitoring panel, which is easy to use and allows you to monitor changes in FPS quickly, the number of enemies in the scene, etc. Let's quickly set up the FPS monitoring.
Let's setup a quick FPS monitor. First, let's get an instance of the graph node, as shown below, representing a maximum value of 60 and up to 14 data segments.
const Debug = this.menu.addGroup("Debug");Debug.addGraph("FPS", null, 60, 14);this.graph = Debug.node.getChildByName("FPS").getComponent(eGraph);
Frames per second can then be counted in the update and pushed to the eGraph panel.
time = 0;counter = 0;update(dt) { this.counter += 1; this.time += dt; if (this.time >= 1) { const graph = this.graph; if (!graph) return; graph.updateData(this.counter) this.time -= 1; graph.NameLable.string = "FPS: " + this.counter; this.counter = 0; }}
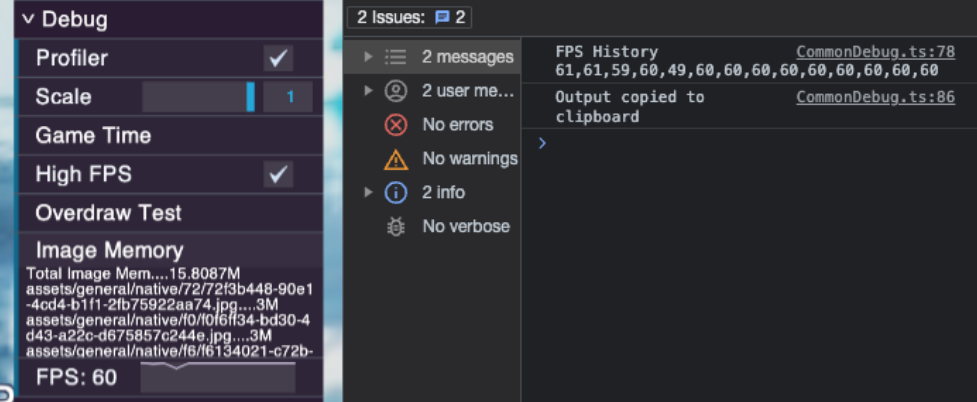
We can also add a click event to the Graph, and by clicking on the panel, we can get the historical curve node data.
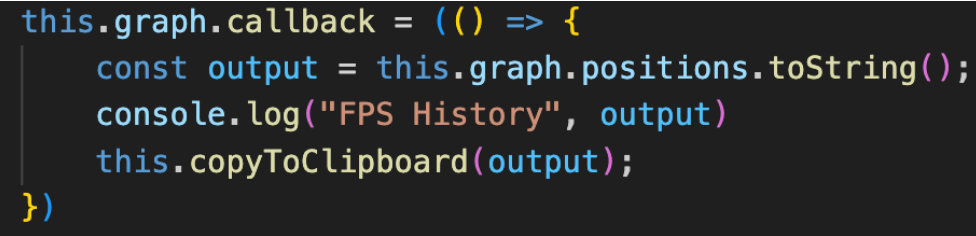
This data is also copied to the clipboard for easy paste viewing.
Overdraw View
Overdraw is when the same pixel point is rendered multiple times, which is usually caused by content redundancy, messed up layers, or logic errors. The debug panel allows us to use code to batch replace the sprite's material in order to see the overdraw more clearly.
testOverdraw() { this.overdrawMode = !this.overdrawMode;
const children = this.canvasNode.children; const material: Material = this.overdrawMode ? this.overdrawMat : this.defaultMaterial;
children.forEach((child) => { if (child == this.menu.node) return; const sprites = child.getComponentsInChildren(Sprite); sprites.forEach((sprite) => { if (!this.defaultMaterial) { this.defaultMaterial = new Material(); this.defaultMaterial.copy(sprite.material) } if (sprite.node.name !== this.node.name) { sprite.material = material; } }) })
}
For example, this Banner below looks normal:

However, there are many other sprites hidden underneath this Banner:

In real projects, these situations happen quite often. Script logic errors, or forgetting to remove a test node, can lead to an Overdraw. By clicking the Overdraw button, we can see that there are multiple sprite images rendered at that pixel point.
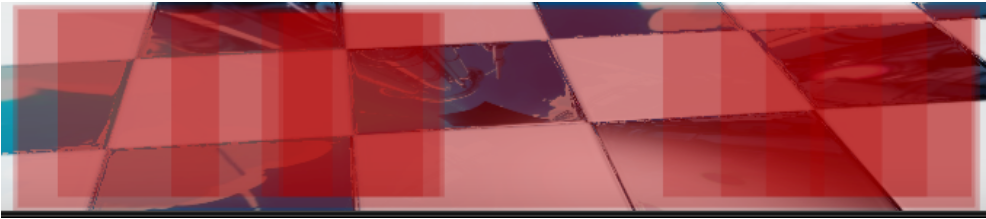
The more times we repeat the rendering, the darker the red color will be. For the Overdraw part, we can solve it by the following methods.
- Hide the sprites in the background that don't need to be rendered
- Cut the big image to avoid large transparent pixels in the center.
Make it a habit to view Overdraw, which can reduce the pressure of GPU rendering and reduce the heat of your phone.
Game speed control
By overriding the engine's tick function, we can slow down the global speed, which is very helpful for animation debugging. This is very helpful for animation debugging, and it can be used for special needs like bullet time, slow motion, accelerated playback, and more.
@ccclass('TimeScale')export class TimeScale extends Component { static scale = 1 start () { const originalTick = director.tick; director.tick = (dt: number) => { dt *= TimeScale.scale; originalTick.call(director, dt); } }}
Here, you can use the debug panel to control the global speed for easy debugging of animations and effects.
Image Memory Usage Analysis
Using the debug panel, we can go through all the image resources in assets and sort them by size so that we can identify the images with the highest memory overhead. The results are automatically copied to the clipboard for further analysis and processing.
getImageMemory(): string { const assets = assetManager.assets; let images: ImageAsset[] = []; assets.forEach((asset) => { if (asset instanceof ImageAsset) { images.push(asset); } }) images.sort(function (a, b) { return b.height * b.width - a.height * a.width; }); let output = ""; let total = 0; /* get all imagessets mem */ images.forEach((image, i) => { const self = image; const native = self._native; const url = self.url; const num = Math.floor((self.width * self.height * (native.indexOf('jpg') > 0 ? 3 : 4) / 1024 / 1024) * 10000) / 10000; total += num; output = output + "\n" + url + "...." + num + "M"; }) total = Math.floor(total * 10000) / 10000; output = "Total Image Mem...." + total + "M" + output; console.log("Image Mem==", output) this.copyToClipboard(output); return output; }
This will support printing all images' paths and memory footprints to the clipboard.
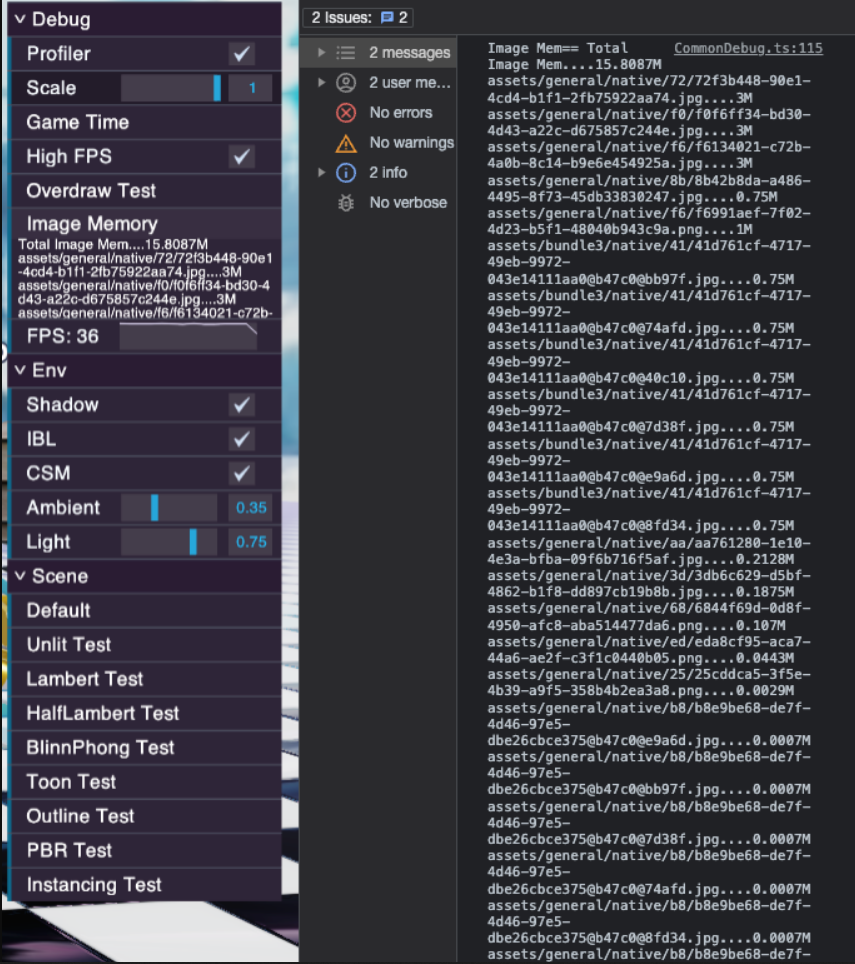
We can locate images with high overheads by the path and the UUID name of the image, which can be optimized this way for images with high memory usage.
- JPG format is 25% less memory intensive than PNG because it does not have an alpha transparency channel. For background images, JPG format is also recommended.
- For some large images with 1920 resolution, you can compress the resolution to 1280, which is more effective when used with JPG.
- The more commonly used buttons and UI images can use a nine-panel grid, cutting out the middle area to reduce the image resolution.
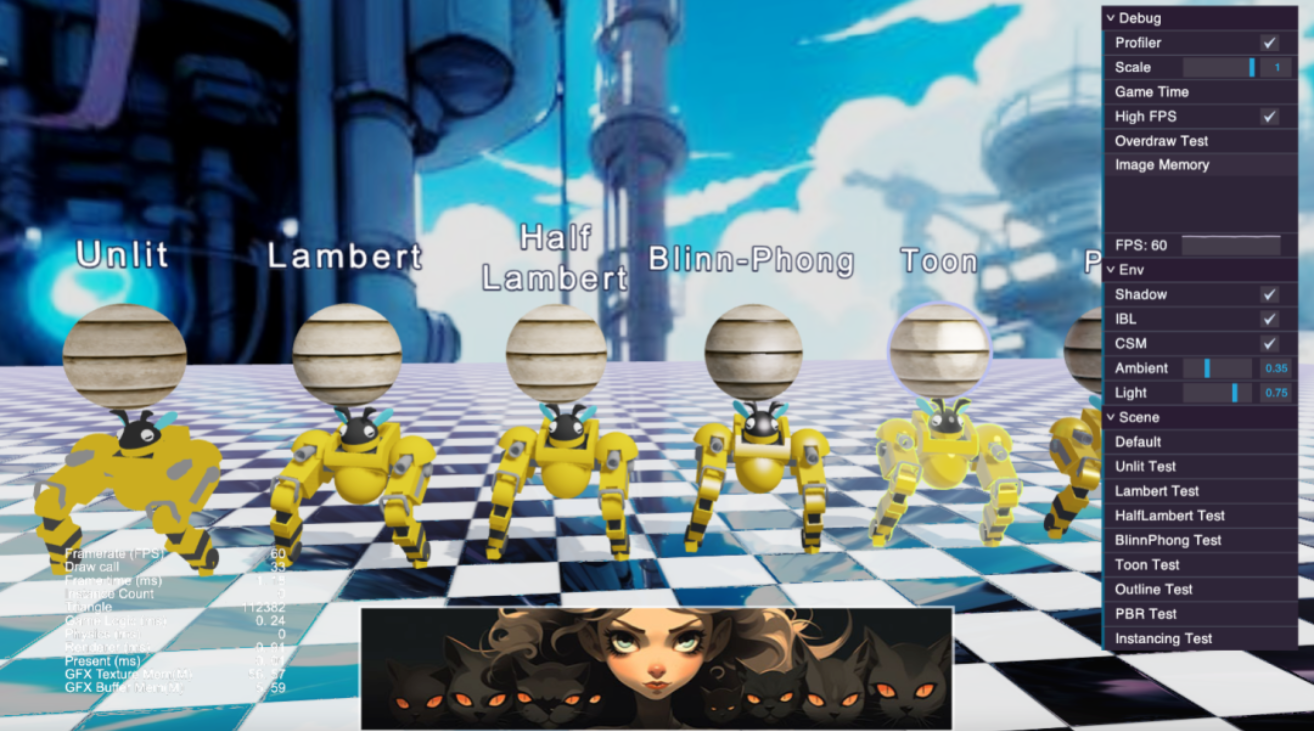
Setting Environment Variables
In 3D game development, there are many environment variables, and we can get most of the settings through globals environment variables.
const scene = director.getScene();const globals = scene.globals;const light = scene.getComponentInChildren(DirectionalLight);const ambientScale = globals.ambient.skyIllum / 100000;const lightScale = light.illuminance / 100000;this.menu .addGroup("Env") .addToggle("Shadow", (t) => { globals.shadows.enabled = t; }) .addToggle("IBL", (t) => { globals.skybox.useIBL = t; }) .addToggle("CSM", (t) => { light.enableCSM = t; }) .addSlider("Ambient", (p) => { globals.ambient.skyIllum = p * 100000 }, ambientScale) .addSlider("Light", (p) => { light.illuminance = p * 100000 }, lightScale)
By dynamically debugging these parameters, performance and screen problems can be quickly localized.
Get the source code for free
In addition, easyMenu is also a handy tool for quickly adding menu components. It has built-in buttons, lists, editboxes, slider, graph, and many other components.
You can download an updated version from my Github account. If convenient, you can give a Star to help show your support: https://github.com/iwae/easyMenu
I appreciate your support, and we will continue to work hard to output more helpful content for you.